
This is a rather late announcement regarding our dashboard challenge, which came to a close at the beginning of March. We’re pleased to announce we received two excellent submissions from contributors Joe Clapis and metanull. They have claimed their POAPs and will share the $5k prize money between them.
Here’s a brief overview of their respective submissions.
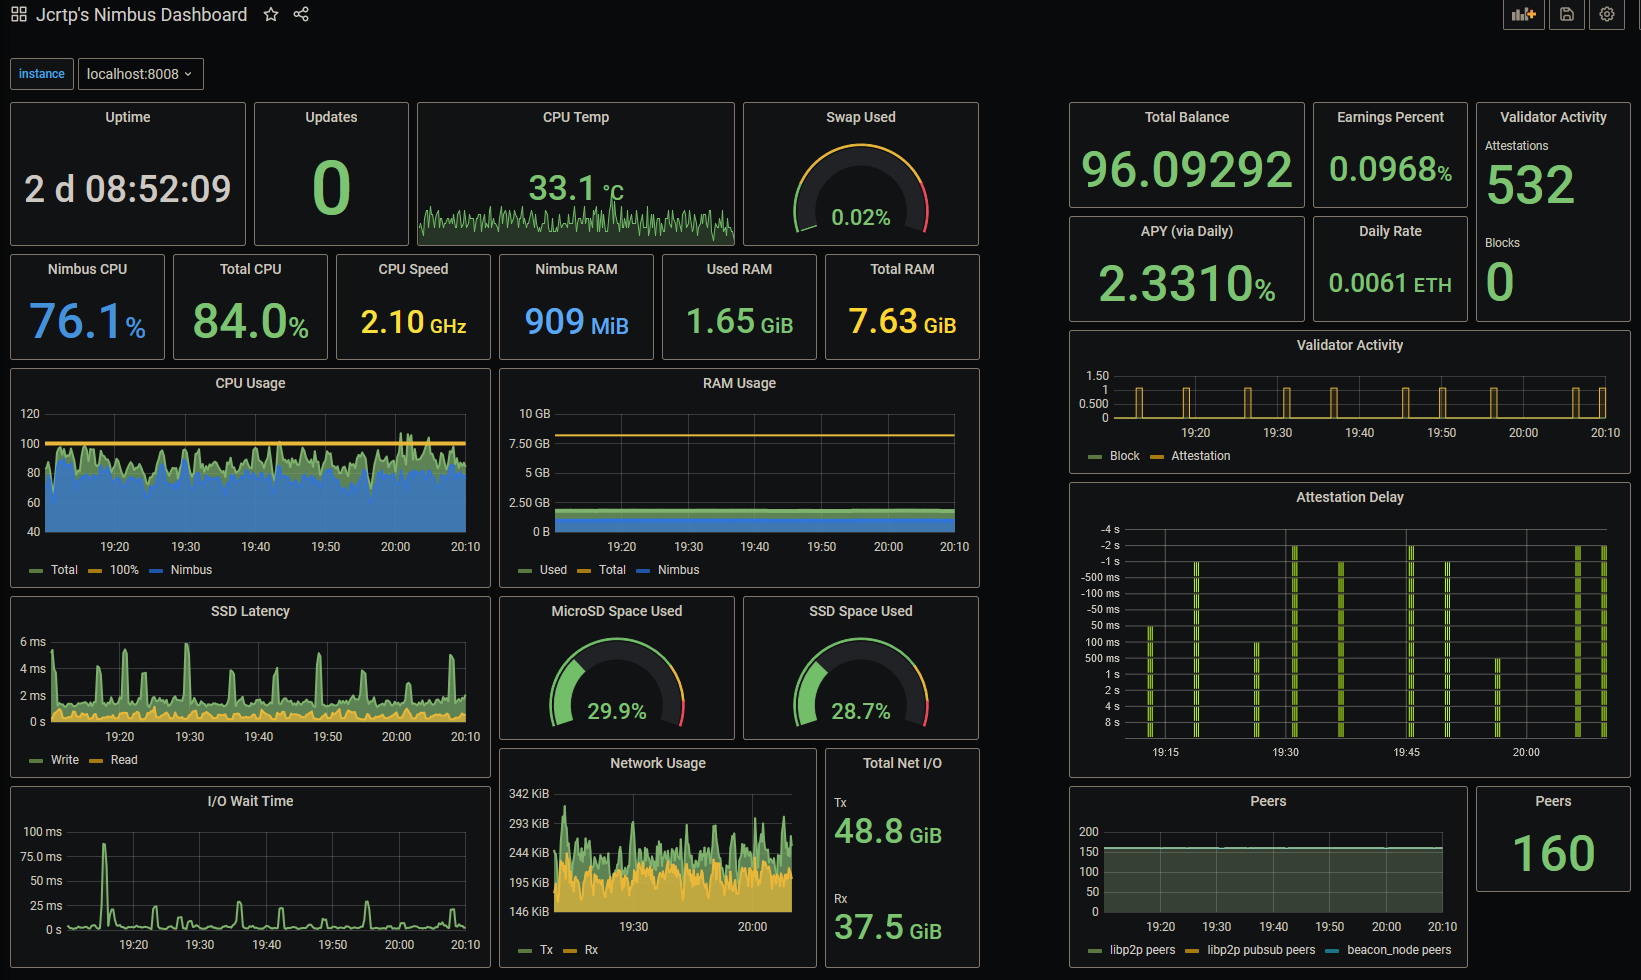
Joe Clapis
Joe – who’s done some brilliant work integrating Nimbus with Rocket Pool – has created a wonderful guide where he takes you through how to set up a Grafana server on your Pi – using his dashboard as an example (his dashboard is the one featured at the top of this post).
In his words:
This captures just about every metric I think I’d like to see at a glance.
Be sure to check out his guide here: https://github.com/jclapis/rp-pi-guide/blob/main/Grafana.md
Metanull
Metanull chose to submit an adaptation of a dashboard he originally wrote for Prysm, aimed primarily at users rather than developers.

He’s also provided a detailed guide explaining how to use it.
Note that this dashboard does rely heavily on three prometheus exporter tools: node_exporter for system metrics, json_exporter for ETH price, and blackbox_exporter for ping times.
The good news is that you don't need to use all these tools, as long as you take care of removing the related panels.
We can’t thank you enough for the time and effort you put into this 🙏 We’ll be adding both of your dashboards to the Grafana section of the Nimbus Book shortly.
If you haven't done so already, and would like to stay abreast of all our updates, please subscribe to our newsletter.
P.S. For those of you using Docker, you'll be pleased to hear that our next release will have metrics support compiled by default – which means you'll finally be able to use Grafana with Nimbus :) We hope to get this release out either tomorrow or Friday.